A Beginner’s Guide to Understanding KPIs
What Are KPIs?
Launching a business is a feat of its own but once your business is up and running, you’ll want to know how it’s performing. To do this, you’ll want to begin tracking performance indicators or KPIs. Key performance indicators are quantitative and qualitative data that is available on various paid platforms but the industry standard is Google Analytics which is free! It does require setting up an account and adding code to the page(s) to be tracked but once these relatively quick steps are completed, you can begin seeing data populate into your new Analytics account within a day or two.
When analyzing KPIs, the initial challenge is to understand what the data means for your business. A rightfully common question when reviewing is, “Well is that good?” And to be honest, this is not always a simple question to answer. A site with 20 orders in a week may be a less-than-stellar performance for some businesses. But what if the site with 20 orders actually is a relatively unknown brand that only launched a week ago? Those 20 orders maybe should be celebrated. Your business’ particular goals, history and trends are the best barometers of performance. Therefore, tracking and analyzing your business’ performance regularly will dictate your best average KPI expectations.
Key KPIs
There are a few KPIs that are useful on their own but are also used to calculate other KPIs. These are number of sessions, number of orders (or transactions) and revenue from those orders. A session is defined as a visit to the website by a client. And revenue and number of orders I assume are well known but I’ll define them as the heart and soul of your business the amount of money your business takes in after accounting for any discounts or deductions while orders are the number of purchases that occur on your site. All three of these KPIs are particularly useful when tracked daily, weekly and monthly as they provide the overall rate of activity on your site.
This brings me to my personal favorite KPI (and yes, I have a favorite KPI…everyone’s got their thing…), conversion rate. Google Analytics by default calculates conversion rate based on the number of orders compared to the number of sessions for a selected period. However, you can create custom conversion goals based on other factors like number of downloads of a file or the number of email registrations vs. sessions to a page. These options are valuable to businesses that are still building their brand awareness so order quantity may be limited or simply do not exist. For my example though, I’ll be focusing on conversion rate as the percentage of orders vs the number of sessions.
So say last week, your site had 200 visits and a total of 10 orders. This results in a 5% conversion using the formula 10 ÷ 200 = .05 = 5%. As mentioned, your own business trends will dictate if this s a strong version rate or one that warrants further review and optimization.
Average Order Value (AOV)
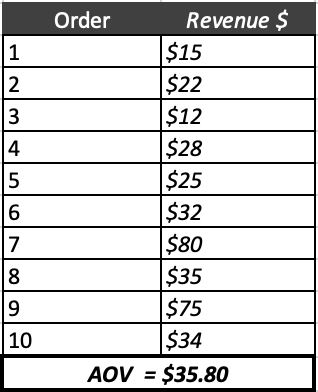
Another KPI worth tracking is average order value (AOV) which is exactly what it sounds like. AOV is the average monetary value of your orders for a designated period of time. Below is the order value for each of the 10 orders mentioned in the conversion rate example. Ranging in dollar amount from $15 up to $80, the average order value is $35.80.
But what can you do with an AOV? AOV gives you data on the shopping habits of your clientele. A $35.80 AOV tells you that you can create a free shipping threshold anywhere from $36 to around $45 as this range is within the purchasing threshold of your clients. $50 may be too high and not drive interest while you may lose money by setting a threshold at $35. This AOV tells you that you can create a promotion offering 20% off a cart subtotal of $45. This allows for purchases to be a minimum of $36 after the discount, retaining your AOV. Do expect to see other numbers fluctuate during these promo periods like an increased number of visits and orders. You may also see bounce rate increase but more on that later… Note that KPIs aren’t typically rounded to the nearest dollar or whole number. Because KPIs can be used to create business margins or for other cost analyses, rounding may skew numbers to the point of being inaccurate.
IPT or UPT
Units Per Transaction (UPT) or Items Per Transaction (IPT) is the average number of items purchased in a transaction. Below is the number of items purchased in 10 separate orders. Using the average formula, the UPT (or IPT) for these 10 orders is 3.9.
Both average order value and units (items) per transaction are two KPIs that are able to be influenced in ways that affect incoming revenue. Creating promotions that increase AOV will bring in a higher amount of revenue for the promo period. An example of this is offering a gift with purchase with orders higher than the standard AOV. Another option if your cost margin allows, is offering a gift, free shipping, or a discount with orders containing 4+ items if your average UPT is typically below 4 items. Tip: You’ll want to be aware of your cost margin when creating promotions to ensure that your promotions are not increasing your costs to a point that is no longer beneficial to your bottom line.
Click Thru Rate (CTR)
Click Thru Rate (CTR) is a KPI that can be tracked across several channels be it site links and sales funnels, paid search campaigns, affiliate ads or email marketing. CTR calculates the number of clicks a call-to-action receives. These links can be from the content of an email, the ad on a Google search page or the clicks on the “Shop Now” button on your home page. Essentially, CTR denotes how effective your messaging leading to the click is.
To calculate CTR, we’ll say that 1000 views of an ad from paid search resulted in 75 clicks on the ad which then led to a landing page related to the offer. This denotes that 75 people found the ad intriguing enough to want to know more about its offerings. This results in a 7.5% CTR. Here’s the formula that gave us 7.5%.
CTR = (Clicks / Email sends) * 100
CTR = (75 / 1000) * 100
CTR = 7.5%
Bounce Rate
Bounce rate is the rate that visitors leave the site upon visiting only one page. If that same ad that drove 75 people to click it, generating a CTR of 7.5%, also has a bounce rate of 45%, this means that of the 75 people that clicked the ad, 45% left the site without taking another action on the site. This equates to approximately 34 people having bounced from the site.
Bounce rate can be influenced by a number of factors. Sometimes, a high rate makes sense and is valid. This can be the case for a campaign with a landing page that collects email registrations with no other action needed by the visitor. Mobile visits also play a role in bounce rates. How many times have you accidentally clicked an ad on a news site just to return to the original page that led you there?
As for the example above related to a promotional offer, because promotions usually aim to increase brand awareness, these campaigns attract the attention of customers new to you. When attracting new visitors who are unfamiliar with your brand, it's common for some of them to show only mild interest in the content or offers. As a result, they may leave your site after briefly exploring the initial key details.
However, a high bounce rate can also be a symptom of issues with the campaign message or a broken landing page, making the visit unappealing for the visitor. Therefore, it is important to understand the workings of your site and the intention of your campaign to gauge any optimization opportunities that can turn the performance of your campaign around.
Wheww…I know that was a lot. But this is a short list of KPIs available for you. Analytics platforms like Google Analytics have so many other default and custom KPI options, it really just depends on your business needs. Again, Google Analytics is free so you can begin tracking this information with a minimal amount of setup time and have this information available when you are ready to use it.
Final tip: set up your Google Analytics account and add the tracking tags to your site that will be available in your account sooner than later. This will allow tracking to begin and historical data will be available when you are ready to research and action against the KPIs for your business. Start harnessing the power of website KPIs today to gain insights, optimize performance, and drive the success of your online business.
Happy tracking! (that was cheesy, I know…just work with me…)